# Finding dead bodies
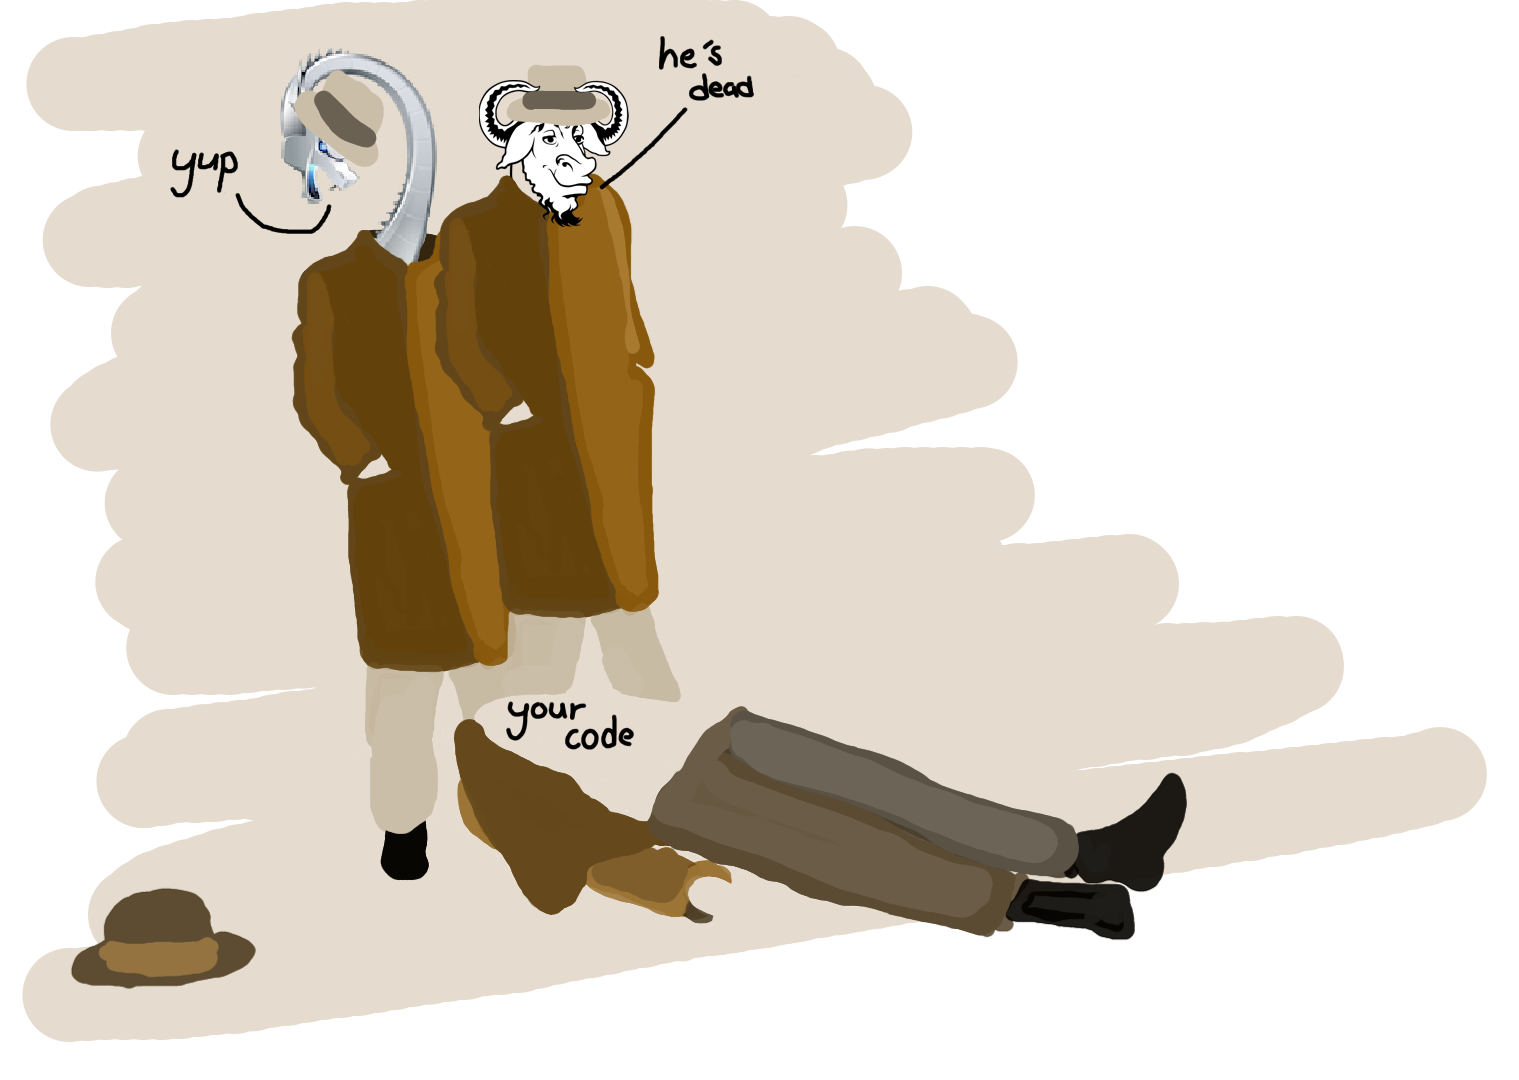
Let's take a brief look at tools that help us find dead (function) bodies! Exciting! This can be really useful in larger and older projects, where you're not quite sure if everything's needed and there's simply too much to check by hand.
These tools are `gcov` from GNU-land and LLVM's SantizerCoverage or `sancov`. Both tools function much in the same way, you add a few compiler flags which tell the compiler to add some extra instrumentation to every basic block, function, or CFG edge. During runtime this instrumentation keeps track of information such as: how many times a given basic block is ran, which is then dumped to a file.
Finally this newly dumped file is then fed into either `gcov` or `sancov` to get information about the code you just ran.
## `GNU's gcov`
There are two equivalent ways to tell `gcc/g++` to instrument your code:
```sh
gcc main.c -fprofile-arcs -ftest-coverage -lcov
gcc main.c --coverage
```
This will then produce a `a-main.gcno` which contains CFG information, and once your run `./a.out` you will also get a `a-main.gcda` containing the coverage information. Feeding the `.gcda` file into `gcov` you can get a human readable `main.c.gcov` which overlays this information ontop the source code.
```sh
gcov *.gcda --demangled-names --use-colors
```
For more see
```bash
man gcov
```
## LLVM's `sancov`
Similarly to `gcov` to use LLVM's `sancov` you simply add a few compiler flags to `clang/clang++`
```sh
clang main.c -g -fsanitize=address -fsanitize-coverage=trace-pc-guard
```
Here `-fsanitize-coverage=trace-pc-guard` will tell the compiler to insert a callback at every edge in the CFG. ASAN here provides a default implementation of this callback which counts the number of times it gets called among other things. During runtime your executable will produce a `.sancov` file containing coverage information. Using `sancov` we can then use this newly dumped file
```bash
# print coverage info in json format, still not super useful
sancov -symbolize *.sancov a.out
# print a list of functions covered by the last run
sancov -covered-functions *.sancov a.out
# print a list of functions _NOT_ covered by the last run
sancov --demangle -not-covered-functions *.sancov a.out
```
```
-fsanitize-coverage={edge,bb,func},trace-pc-guard
```
### Extra LLVM goodies
`sancov` can to a lot more things, please see
https://clang.llvm.org/docs/SanitizerCoverage.html
For instance, you can have LLVM insert callbacks at everything from indirect calls to GEPs, but you'll have to implement the callbacks yourself though.
```bash
-fsanitize-coverage=trace-pc,indirect-calls
-fsanitize-coverage=trace-cmp
-fsanitize-coverage=trace-div
-fsanitize-coverage=trace-gep
-fsanitize-coverage=trace-loads
-fsanitize-coverage=trace-stores
```
## Gettin' fancy like it's the 1990s
So you want a cool looking HTML page to show your boss, we've got you covered.
On the GNU side there's a third-party tool called `lcov` which reads `.gcda` files into it's own format. First run
```bash
lcov --capture --directory . --output-file coverage.info
```
which will recursively find all `.gcda` files starting from the current `.` directory. To get a fancy HTML you then run
```bash
genhtml coverage.info --output-directory out
```
which will dump a bunch of `.html` into `out`, simply open `index.html` as you usually would.
On the LLVM side of the fence you have `coverage-report-server.py` usually found within the `llvm/tools/sancov/` path in the LLVM source code (you can probably find it in some package as well).
```bash
./llvm/tools/sancov/coverage-report-server.py --symcov main.symcov --srcpath .
```
you will also have to specify the `.symcov` file to use and where it can find your source code, here `.`. It will then open a server on `127.0.0.1:8001` by default which will serve you some HTML goodness.